Mimic is designed specifically for comparing the UI behavior of an app across different devices, different
Android versions, and different app versions.
This design choice stems from a common problem that Android developers and researchers face—-how to test whether or not an app behaves consistently across different environments or internal changes.
Mimic allows Android app developers to easily perform backward and forward compatibility testing for their apps. It also enables a clear comparison between a stable version of app and a newer version of app. In doing so, Mimic allows multiple testing strategies to be used, such as randomized or sequential testing. Finally, Mimic programming model allows such tests to be scripted with much less developer effort than other comparable systems.
Design and Runtime
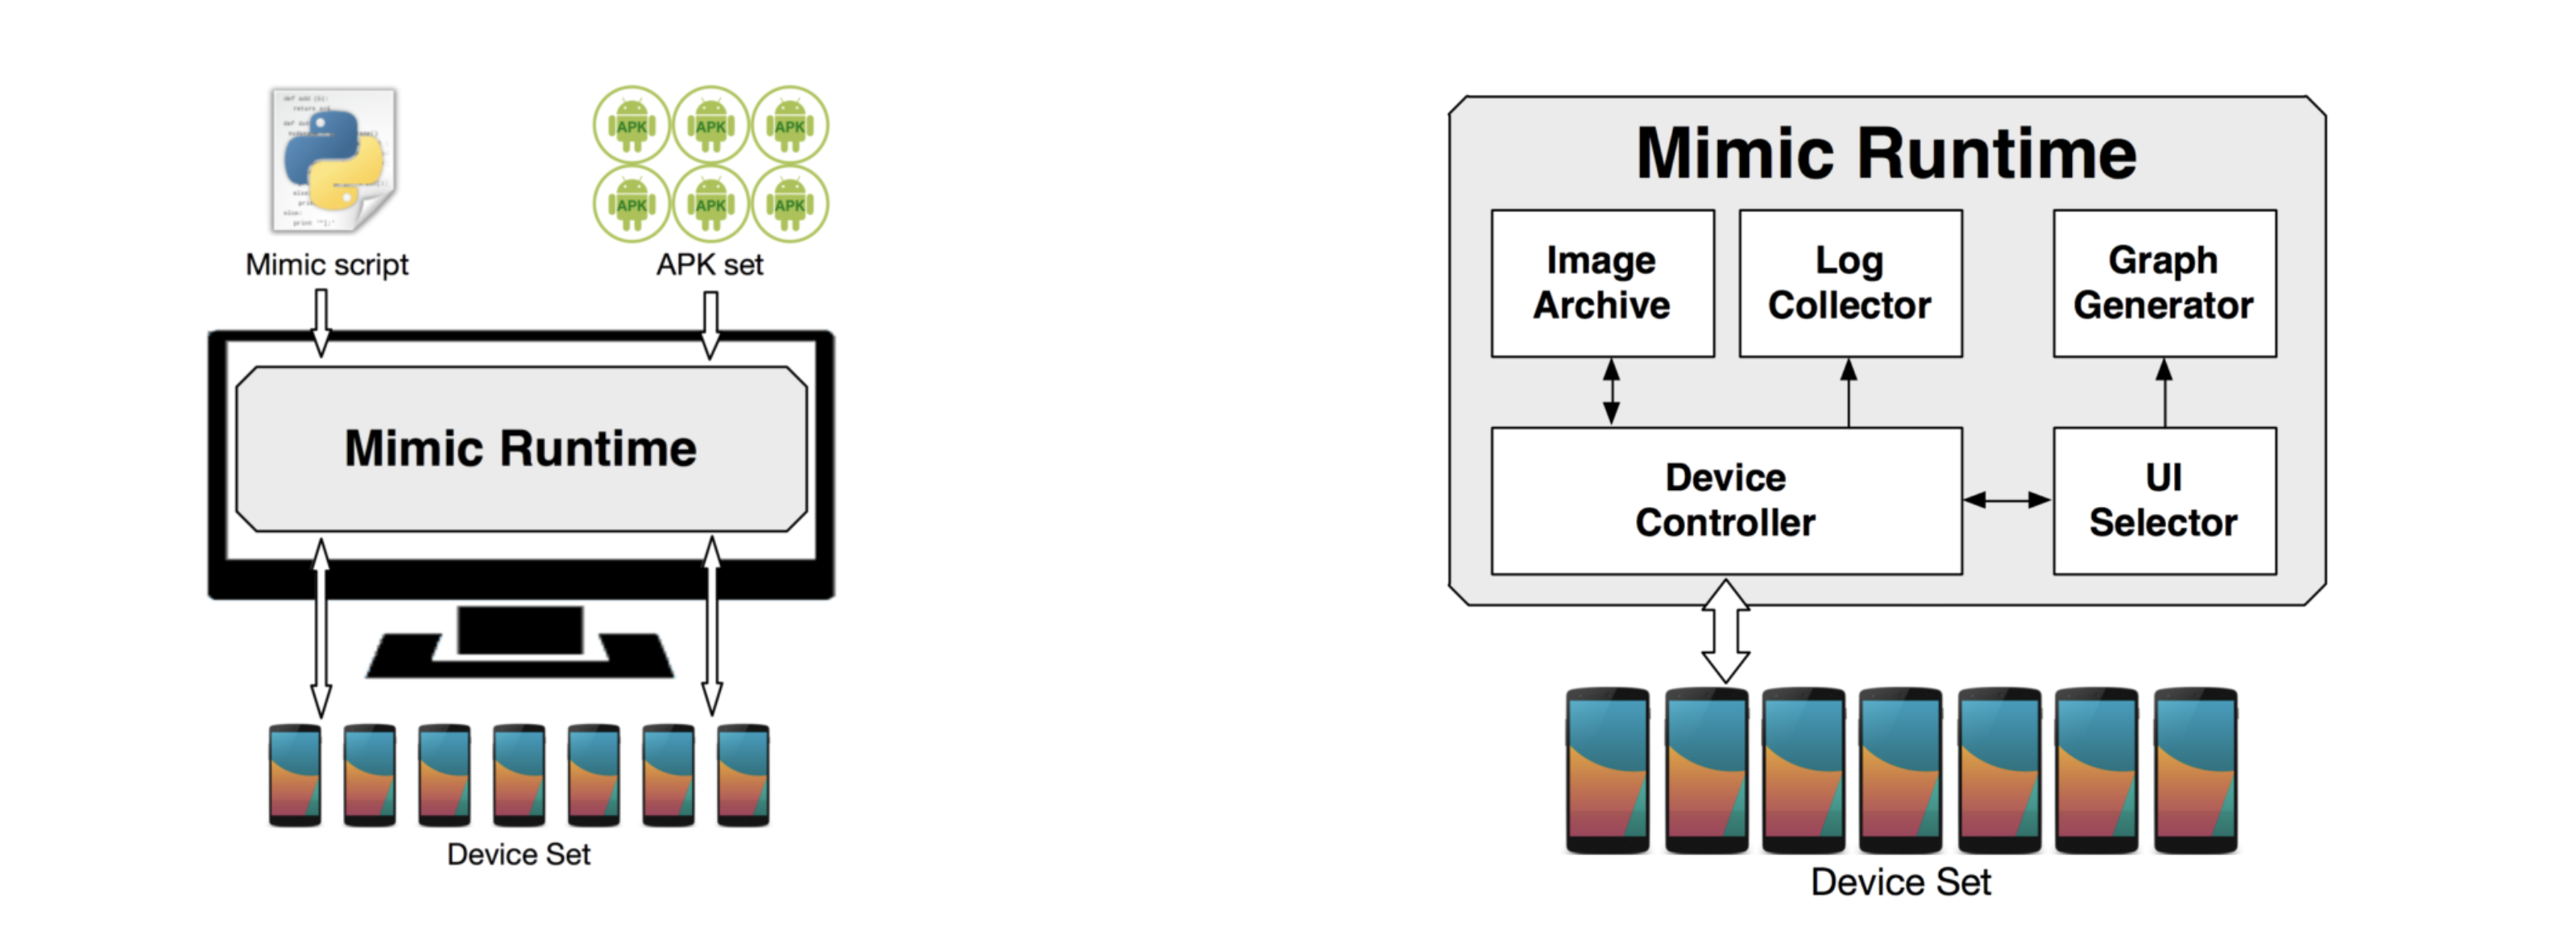
A design figure on above shows the Mimic architecture. Mimic takes as input a set of apps and a Mimic script. The Mimic runtime that runs on a desktop that (described in subsection IV-A) executes the script, and runs specified tests on the set of devices connected. Mimic is designed to be able to scale the number of apps tested as well as the number of devices used. This architecture is managed by the Mimic programming model which provides methods for the setup of the runtime, configuring the set of devices that will be used for testing, specifying UI tests to be run, and the specification of desirable properties of the test runs that need to be logged. While it might be possible to write similar scripts by a tester who understands the nuances of Android devices and tools, Mimic makes this easier with a small set of APIs that provide high-level abstractions and callbacks that are specifically designed for UI compatibility testing.
The Mimic runtime provides the environment for the execution of a Mimic script. It runs on a computer, controls all Android devices connected to it via USB, and displays test results. A runtime figure on above shows the components of the runtime. The main component is Device Controller that executes a Mimic script and controls the entire flow of testing. While executing a script, it interacts with testing devices using Android tools (mainly, adb and UI Automator), and leverages other components.
Testing Result Generation
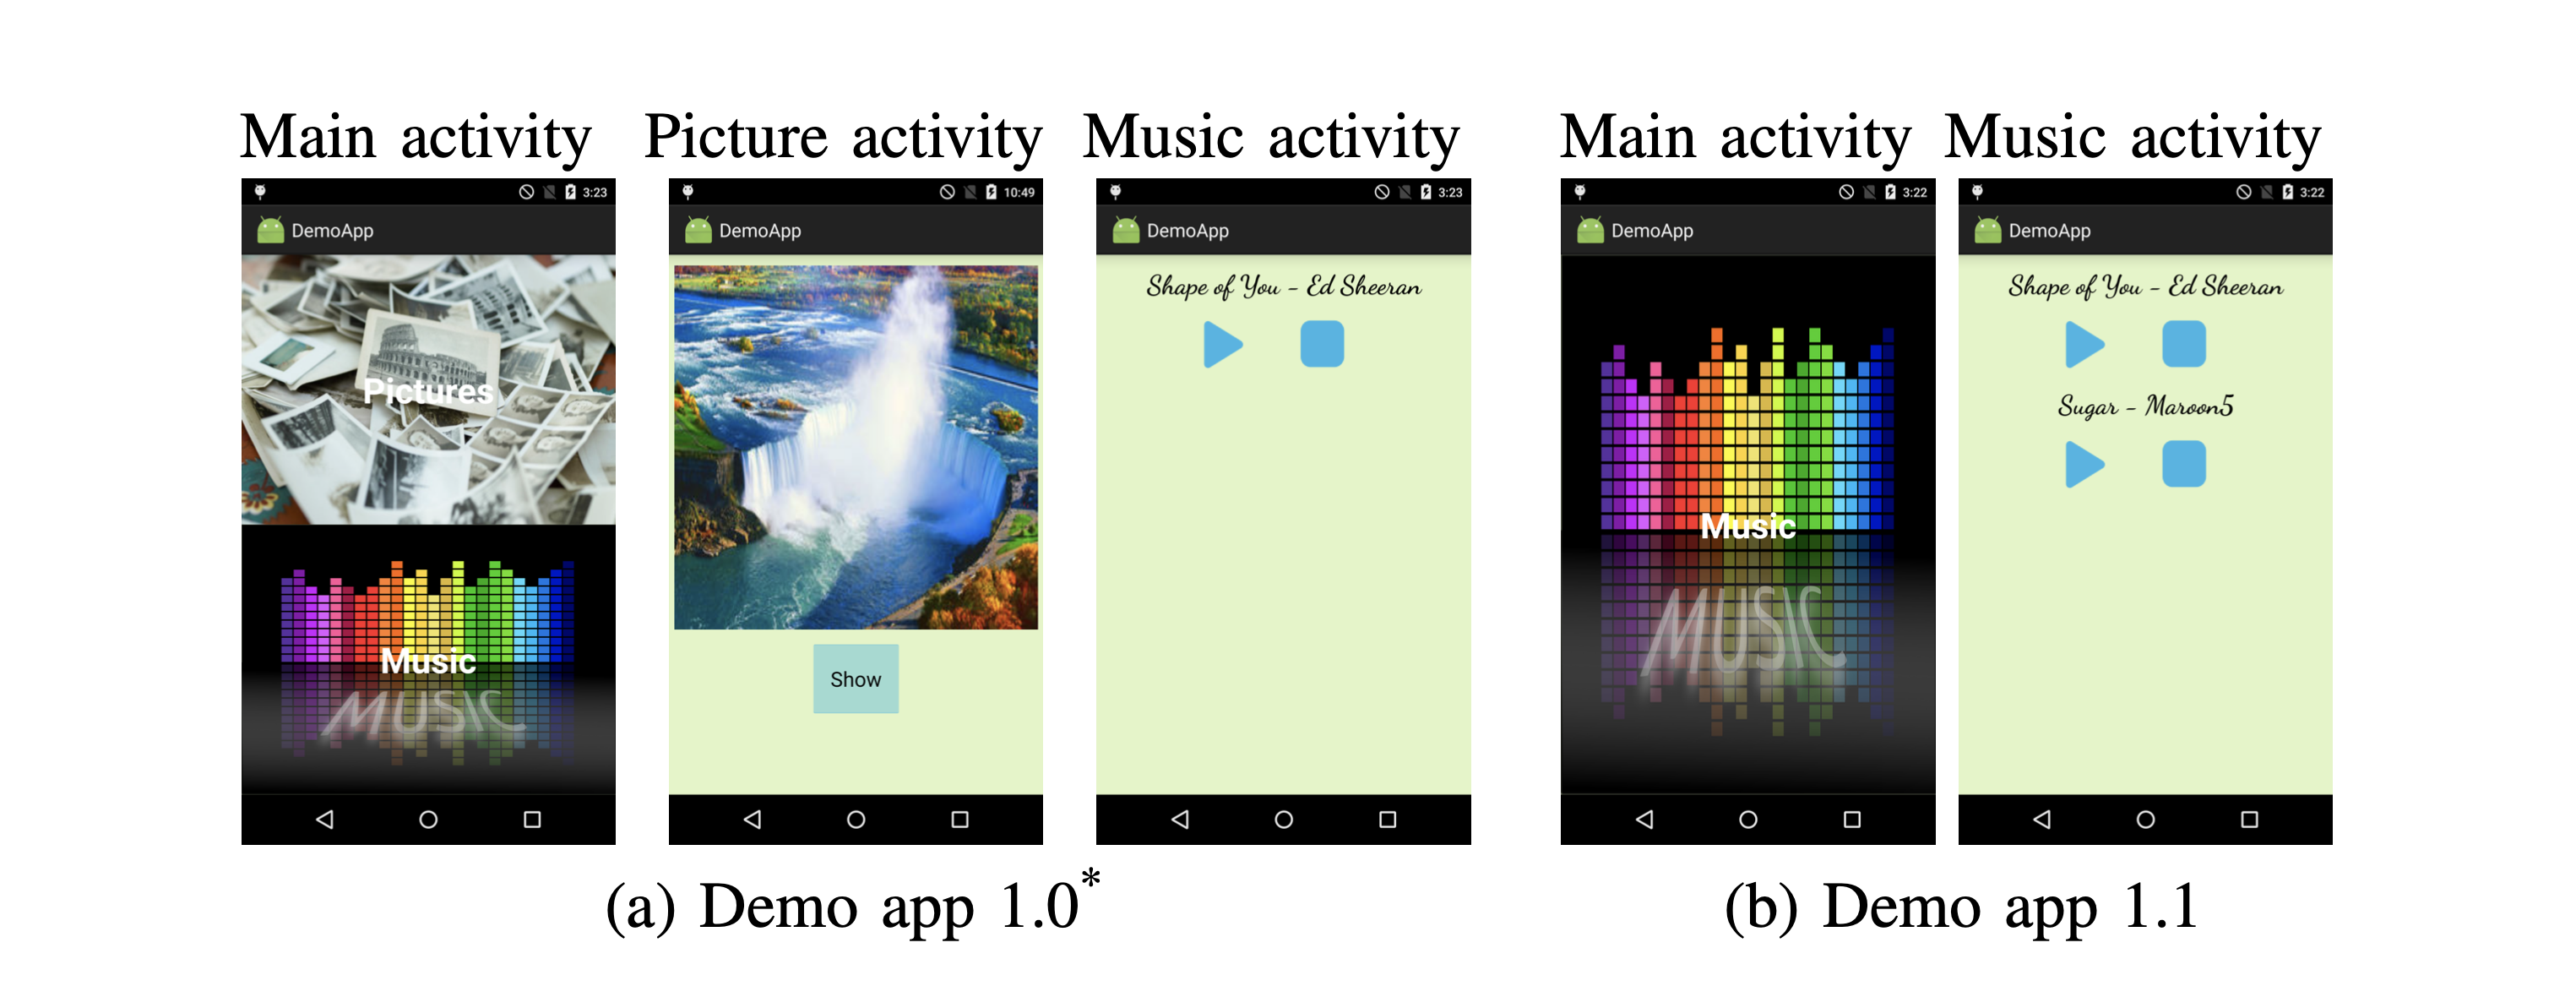
After executing testing logic, Device Controller provides testing results in two forms. First, it uses Log Collector to capture all logs that testing apps generate. Device Controller can display individual logs as well as deltas among the logs from different devices. Second, Device Controller uses Graph Generator to display all UI transitions that occurred during testing. This UI transition graph helps testers visualize how different app instances behaved. Screenshots and trees on the above show visualizations of an example using a demo app we have developed. There are two versions of this app. The first version (v1.0) has three activities, Main, Picture, and Music. However, the second version (v1.1) only has two activities, Main and Music, and there are two more buttons in the Music activity. We intentionally inject one run-time error that causes the app to crash when the Show button on the Picture activity is clicked.
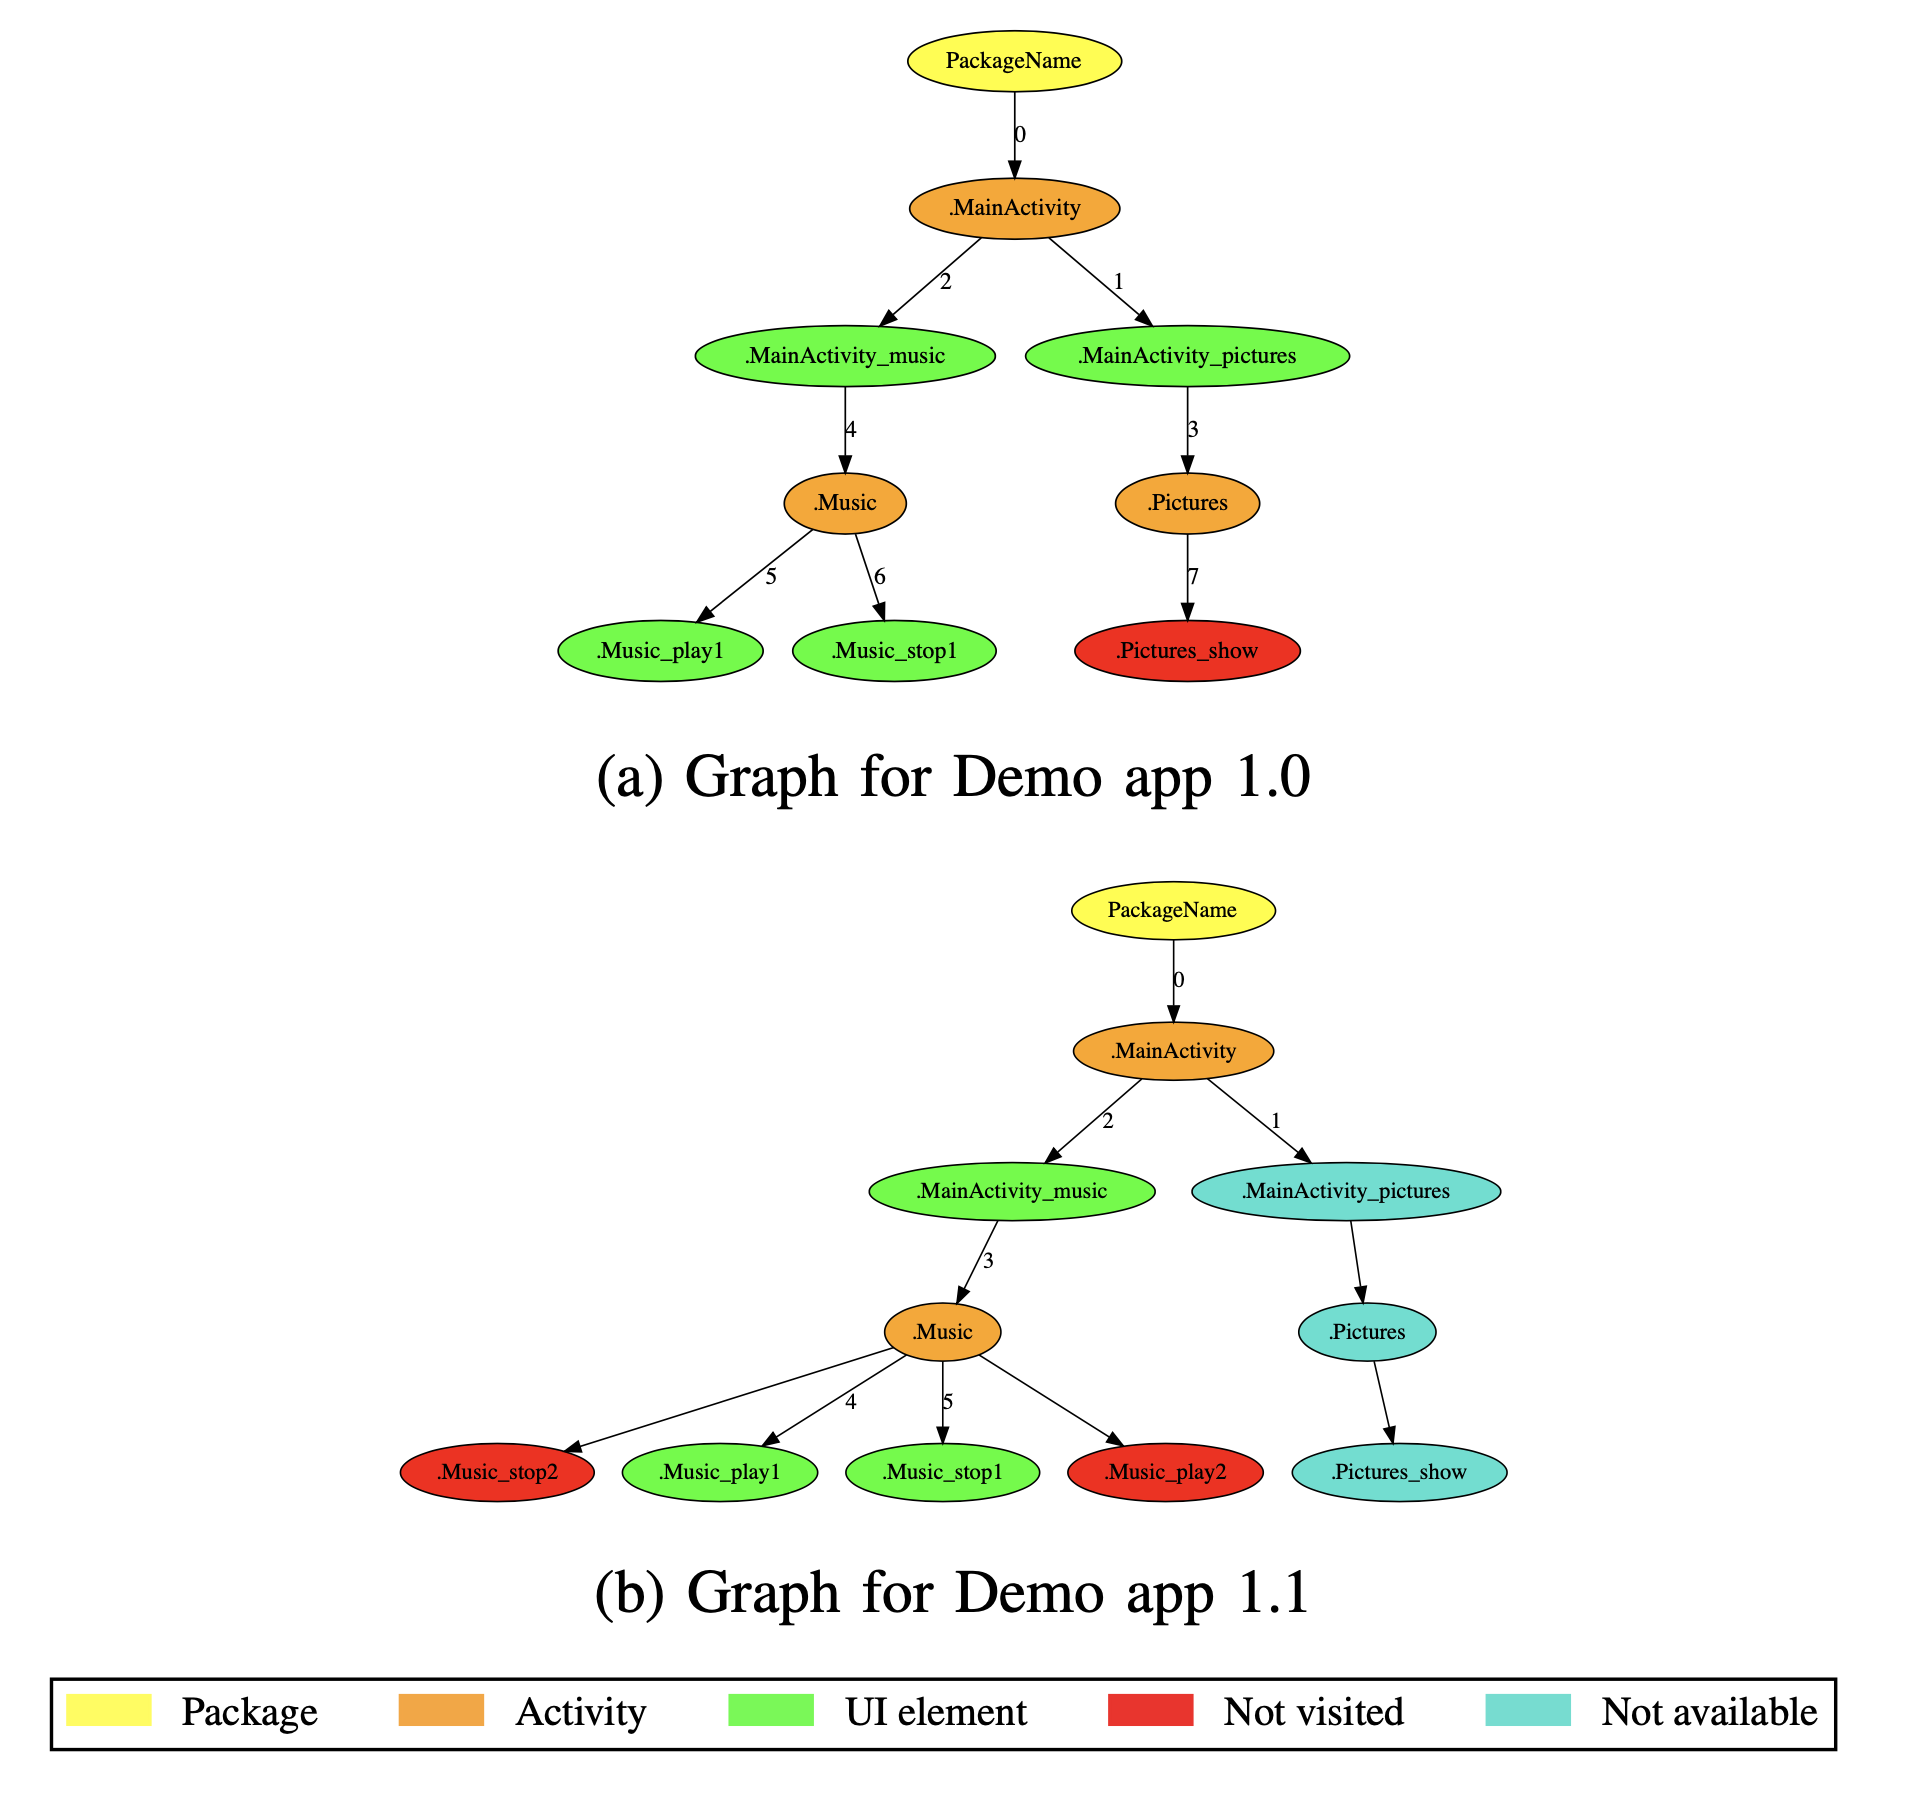
Above trees show an example run. Using our leader-follower model, both versions execute the exact same sequence of UI events. For v1.0, the unvisited node (the Show button) is due to the run-time crash error that we inject; since the app crashes, the button is not explored. For v1.1, the two unvisited nodes (the second Play button and the corresponding Stop button) are due to our leader-follower model; since the leader does not have those buttons, they are not explored in the follower. Using these graphs, testers can easily discover points of run- time errors as well as compare UI differences across different versions.
Enabling Visual Inspection
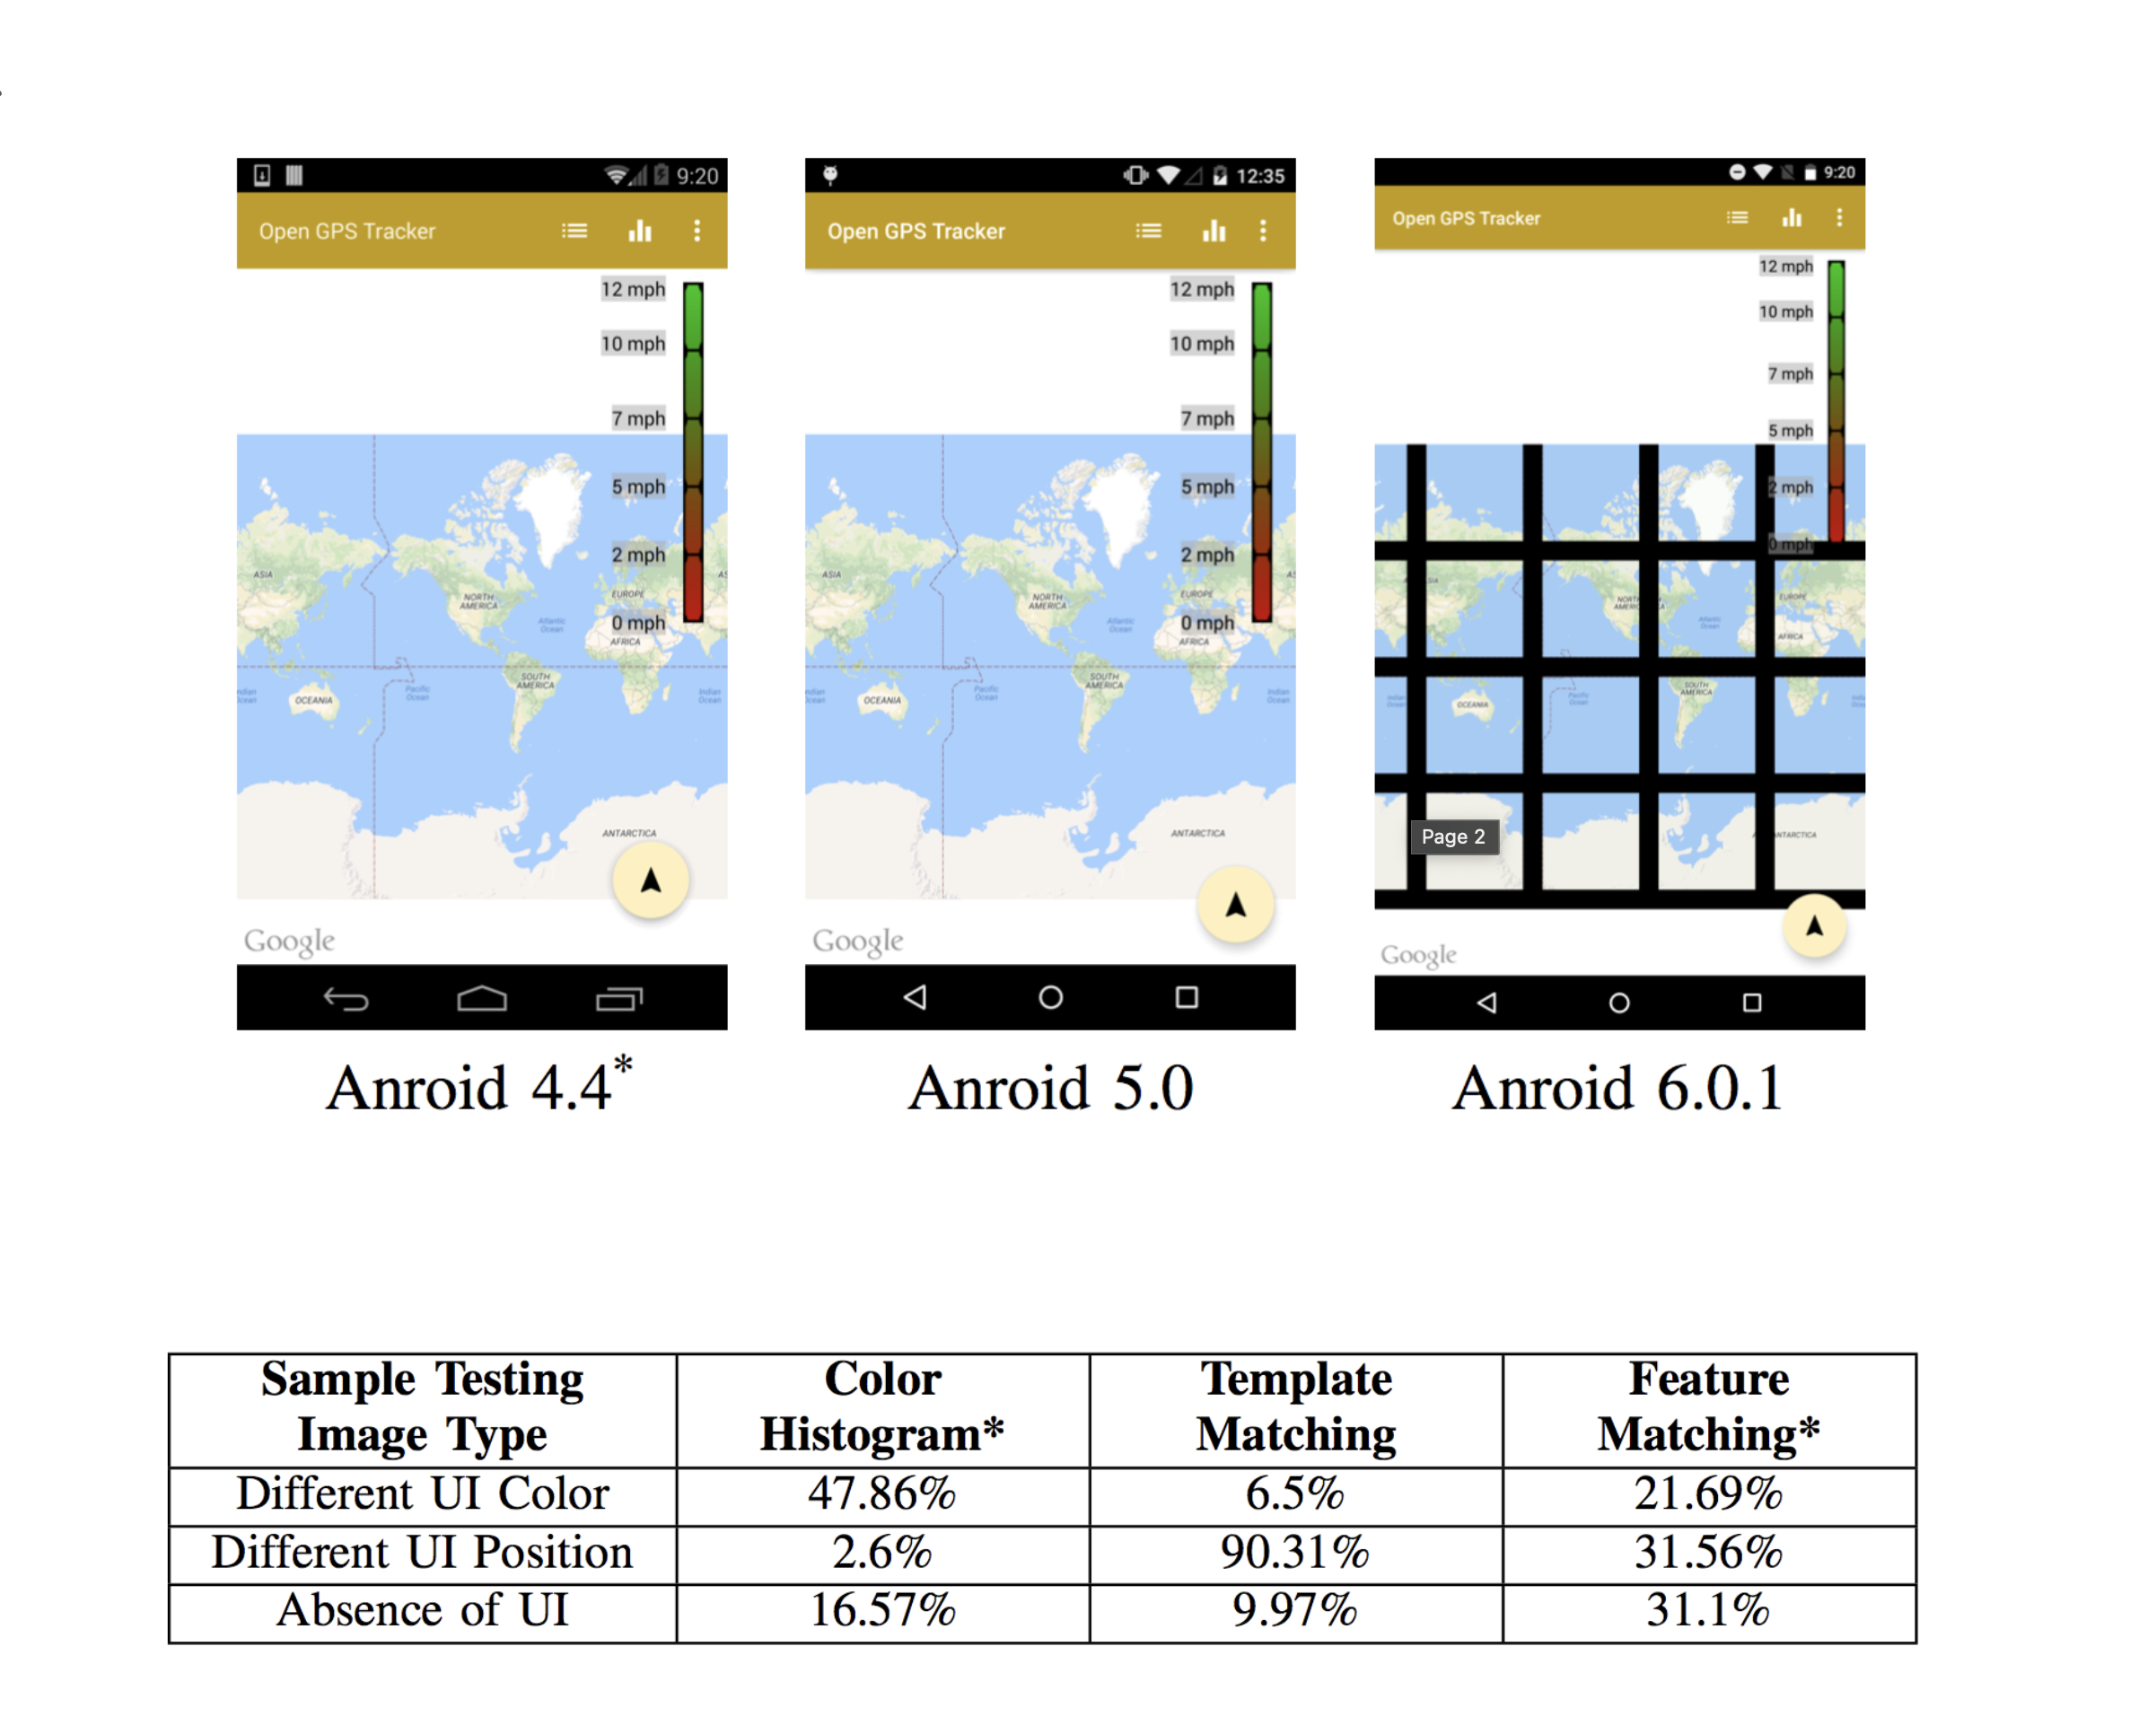
To calculate the UI difference, we have experimented with three popular methods from OpenCV—histogram difference, template matching, and feature matching. Using original screen image of Starbucks app, we create three different sample image types that are possible due to version differences, and we compare each sample image type with the original image using three methods mentioned. A table on the above shows percentage differences from this comparison. While results of template matching show an inaccuracy on all three sample image types, color histogram difference and feature matching have given us satisfactory results either on color difference or on UI feature difference. Mimic takes higher percentage difference between color histogram difference and feature matching.
While we have used a particular set of image processing mechanisms, it is also easy to create other custom mechanisms to quantify visual difference between two screens. Screenshots on the above shows an example of display differences across different Android versions from 4.4 to 6.0.1. In this example, the leader screenshot is about 11.84% different from the image on Android 5.0, and about 65.01% different from the image on Android 6.0.1. By using both diffUITree() and screenshot(), a tester can efficiently detect the display distortion.